There Were Two Events, Not One
The August 3 investigation identified a June ranking collapse across nine pages and treated it as the explanation for the organic decline. Extending the data through August 7 revises that conclusion in an important way. The June event was real, but it cost impressions rather than clicks. A second, separate event on July 24 is the one that actually removed traffic — and the August 3 analysis windows straddled it, which is why it was invisible at the time.
US Organic — Clicks and Impressions per Day
Actual daily figures, not indexed. Impressions have been falling since May. Clicks did not follow — they held around 1,150–1,200 a day all the way to July 23, then fell to roughly 930 within a week.
| Period | Clicks/Day | Impressions/Day | CTR | What It Tells Us |
|---|---|---|---|---|
| May 4 – 31 | 1,204 | 131,903 | 0.913% | Stable baseline, both events still ahead |
| Jun 1 – 23 | 1,145 | 108,601 | 1.054% | Impressions already sliding; clicks intact |
| Jul 6 – 23 | 1,211 | 101,871 | 1.189% | After the June event — clicks fully recovered |
| Jul 25 – Aug 7 | 910 | 90,355 | 1.007% | After July 24 — the actual traffic loss |
The June Event Cost Visibility, Not Visitors
The nine pages identified on August 3 lost roughly 9,885 impressions per day between them — a genuine and large loss of search visibility. But US clicks in the three weeks after that event (1,211/day) were higher than in the three weeks before it (1,145/day). Those pages were ranking for high-volume terms at low click-through; losing them removed impressions from the chart without removing many visitors from the site.
This does not make the June event unimportant — lost ranking is lost future optionality, and the controlled fix we proposed should continue. It does mean it is not the explanation for the sessions RoomSketcher has been losing, and effort spent there will not bring that traffic back.
The June event was unambiguously a ranking collapse
Worth showing plainly, because it is the cleanest ranking demotion on the site and it is qualitatively different from what happened in July. /kitchen-planner/ lost half the results page overnight.
| Date | Avg Position | Impressions | Clicks |
|---|---|---|---|
| Jun 25 | 14.4 | 1,378 | 5 |
| Jun 26 | 13.4 | 1,212 | 7 |
| Jun 27 | 16.9 | 1,065 | 5 |
| Jun 28 | 32.0 | 874 | 3 |
| Jun 29 | 29.9 | 768 | 6 |
| Jul 5 | 38.9 | 785 | 1 |
| Aug 7 | 32.5 | 444 | 1 |
Position 17 to 32 in a single day, and it has never recovered. That is a demotion, full stop — and it is the signature the June 2026 spam update would produce. Note also that /kitchen-planner/ shows no additional step at July 24: it had already been demoted and simply stayed there. Different pages were hit by different events, which is precisely why the two have to be diagnosed and treated separately.
What Happened on July 24
The break is sharp and easy to date. A seven-day trailing average removes day-of-week noise and shows a clean step: the decline begins July 24, runs for about a week, and settles at a new, stable, lower level where it has stayed ever since.
| Date | 7-Day Avg Clicks/Day | Status |
|---|---|---|
| Jul 20 | 1,170 | Stable |
| Jul 22 | 1,198 | Stable |
| Jul 23 | 1,189 | Last normal day |
| Jul 25 | 1,121 | Step down begins |
| Jul 27 | 1,050 | Falling |
| Jul 29 | 948 | Falling |
| Jul 31 | 902 | New floor reached |
| Aug 7 | 917 | Stable at the new level |
An Unconfirmed Google Update Landed the Same Night
Independent SERP-volatility trackers recorded a significant unconfirmed Google update beginning late Thursday July 23 and intensifying through Friday July 24 and that weekend. Google has confirmed nothing since the June 2026 spam update, which ran June 24–26.
Our break date was derived independently from Search Console before we looked at any industry reporting. The two match to the day. That is strong corroboration that this is an external Google change and not something that happened on RoomSketcher's side.
Google names and documents only a fraction of its changes. An unconfirmed update means the search community can measure the effect across thousands of sites but Google has published nothing about it — no guidance, no recovery criteria, no acknowledgement. There is no appeal process and no reconsideration request, because officially nothing happened.
It Is Not Seasonality, Not Us, and Not Just America
Before accepting an external cause, the obvious alternatives have to be eliminated. All three fail cleanly.
Seasonality — the decisive control
The strongest available test is the same calendar window one year earlier. If late July is simply a slow period for floor-plan software, 2025 should show the same shape. It does not.
| Year | Window | Clicks/Day | Impr/Day | Change in Clicks |
|---|---|---|---|---|
| 2025 | Jul 6 – 23 | 1,604 | 139,064 | −0.8% |
| Jul 25 – Aug 7 | 1,591 | 140,006 | ||
| 2026 | Jul 6 – 23 | 1,211 | 101,871 | −24.9% |
| Jul 25 – Aug 7 | 910 | 90,355 |
In 2025 this exact window was flat — clicks moved less than one percent and impressions actually rose. There is no summer dip in this business at this time of year. The 2026 decline is an event, not a season.
Geography and device
If this were a tracking fault, a site change, or a US-market problem, it would show up unevenly. It does not — the drop is broad and consistent, which is what an algorithm change looks like.
| Segment | Clicks Before | Clicks After | Change | CTR Change |
|---|---|---|---|---|
| US — Desktop | 629 | 469 | −25.5% | −14.6% |
| US — Mobile | 555 | 423 | −23.8% | −15.2% |
| Worldwide — All Devices | 3,411 | 2,701 | −20.8% | −10.1% |
Nothing on RoomSketcher's Side Explains This
The nine pages audited on August 3 were all technically clean — HTTP 200, self-referencing canonicals, no noindex, schema intact — and the indexed footprint has stayed stable at roughly 1,600 pages. Desktop and mobile fell together, the US and the rest of the world fell together, and the break lands on the same night as a documented industry-wide volatility event. No deploy, no content change, and no tracking fault produces that pattern.
The Pages Losing the Most Organic Clicks
This is the priority list. Every page is measured in organic clicks per day lost against its own May–June normal — not percentages, which flatter small pages, and not impressions, which do not pay. The Fix column says whether ranking work can recover it, and Engaged says whether the traffic was worth having in the first place.
| # | Page | Position normal → now |
Clicks/Day normal → now |
Lost clicks/day |
Engaged rate · pages/session |
Fix |
|---|---|---|---|---|---|---|
| 1 | /blog/best-floor-plan-software-tools/ | 10.3 → 14.8 | 12.0 → 3.4 | 8.6 | 63% · 1.6pp | SEO can fix |
| 2 | /bathroom-planner/ | 15.6 → 16.1 | 10.2 → 2.4 | 7.8 | 79% · 1.7pp | SEO can’t fix |
| 3 | /blog/12-timeless-shotgun-house-floor-plans/ | 6.5 → 5.0 | 13.4 → 8.4 | 5.0 | 62% · 1.6pp | SEO can’t fix |
| 4 | /kitchen-planner/ | 12.4 → 31.8 | 6.1 → 1.4 | 4.7 | 73% · 1.7pp | SEO can fix |
| 5 | /house-plans/ | 13.5 → 30.6 | 17.5 → 13.0 | 4.5 | 60% · 1.5pp | SEO can fix |
| 6 | /blog/types-of-rooms-in-a-house/ | 4.6 → 5.8 | 5.7 → 1.8 | 3.9 | 45% · 1.2pp | SEO can fix |
| 7 | /blog/ways-to-find-the-floor-plan-of-a-house/ | 6.5 → 5.3 | 12.6 → 8.8 | 3.8 | 48% · 1.3pp | SEO can’t fix |
| 8 | /blog/the-ultimate-guide-to-blueprint-symbols/ | 2.6 → 2.6 | 7.5 → 4.0 | 3.5 | 64% · 1.3pp | SEO can’t fix |
| 9 | /floor-plan-gallery/bathroom/small-bathroom-floor-plans/ | 10.8 → 10.2 | 5.6 → 3.0 | 2.6 | 68% · 2.0pp | SEO can’t fix |
| 10 | /blog/floor-plan-symbols/ | 3.3 → 3.4 | 5.4 → 2.8 | 2.6 | 62% · 1.3pp | SEO can’t fix |
| 11 | /features/ai-convert/ | 7.0 → 20.0 | 4.3 → 1.8 | 2.5 | 76% · 1.5pp | SEO can fix |
| 12 | /floor-plans/blueprint-maker/ | 9.2 → 9.7 | 5.0 → 2.6 | 2.4 | 64% · 1.6pp | SEO can’t fix |
| 13 | /floor-plan-gallery/bathroom/ | 13.3 → 17.1 | 3.4 → 1.0 | 2.4 | 88% · 3.1pp | SEO can fix |
| 14 | /blog/powder-room-layout-guide/ | 3.5 → 2.2 | 3.7 → 1.6 | 2.1 | 66% · 1.3pp | SEO can’t fix |
| 15 | /floor-plan-gallery/apartment/studio-apartment-plans/ | 11.2 → 12.8 | 17.6 → 15.6 | 2.0 | 67% · 2.0pp | SEO can’t fix |
There Is No Single Page to Fix
The largest single casualty is losing 8.6 clicks a day. The top ten together account for 47 — about a third of the 133 clicks/day traceable to identifiable pages. No individual repair moves the headline number, which makes this a portfolio problem rather than a page problem.
Practically: work the list top-down, expect each fix to return single-digit clicks per day, and judge the programme on the aggregate. Start with /blog/best-floor-plan-software-tools/ and /bathroom-planner/ — together 16.4 clicks/day, more than the next three combined.
Roughly 46% of the top-15 loss is ranking, and recoverable by ordinary SEO — 26.6 clicks a day across six pages. The other 54% is not: 31.8 clicks a day across nine pages that still rank where they always did. Section 05 covers what is happening to the second group.
Where the loss sits, by site section
Grouping every reported page by section shows which parts of the site are bleeding, and gives a target for the long tail — those pages are individually invisible in Search Console, but they belong to these same sections.
| Section | Pages | Clicks/Day normal → now |
Lost clicks/day |
Change | Lost per page/day |
|---|---|---|---|---|---|
| Blog | 198 | 144.0 → 98.2 | 45.8 | −32% | 0.23 |
| Floor Plan Gallery | 287 | 106.4 → 83.6 | 22.8 | −21% | 0.08 |
| Tool & landing pages | 29 | 47.3 → 26.4 | 20.9 | −44% | 0.72 |
| Features | 15 | 23.8 → 17.0 | 6.8 | −29% | 0.45 |
| Floor Plans (product) | 8 | 10.3 → 5.6 | 4.7 | −45% | 0.59 |
| Home Improvement | 3 | 2.5 → 1.0 | 1.5 | −61% | 0.50 |
| Convert / pricing | 6 | 6.6 → 5.6 | 1.0 | −15% | 0.17 |
| Other | 22 | 3.5 → 2.6 | 0.9 | −26% | 0.04 |
| Homepage | 1 | 90.7 → 95.6 | −4.9 | +5% | gained |
| Total | 569 | 435.1 → 335.6 | 99.5 | −23% | — |
The Blog Is the Biggest Loss. The Tool Pages Are the Worst Damage.
By volume the blog dominates — 46% of the drop, 45.8 clicks a day across 198 pages. But it is falling at 32%, roughly the site average, and the loss is spread thinly at 0.23 clicks per page per day. It is a broad, shallow decline.
The tool and landing pages are a different problem. Twenty-nine pages carrying 21% of the entire drop, falling at 44%, losing 0.72 clicks per page per day — nine times the rate of the gallery and three times the blog. This is the commercial layer of the site: /kitchen-planner/, /bathroom-planner/, /room-planner/, /house-plans/. Concentrated, severe, and closest to revenue.
The gallery is the healthiest large section — 287 pages down only 21%, at 0.08 clicks per page. And the homepage is the only section that gained.
Engagement Tells You Which Losses to Chase
The Engaged column carries two numbers: the share of sessions Google Analytics counts as engaged, and pages viewed per session. Read together they separate prospects from readers.
- Worth chasing.
/floor-plan-gallery/bathroom/(88%, 3.1 pages),/bathroom-planner/(79%, 1.7),/features/ai-convert/(76%). People arriving here behave like prospects — they go deeper into the site. - Question it.
/blog/types-of-rooms-in-a-house/(45%) and/blog/ways-to-find-the-floor-plan-of-a-house/(48%) engage fewer than half their visitors and average 1.2 pages. Between them that is 7.7 clicks a day — but recovering it buys readers, not prospects. - Beware long time-on-page. The reference pages hold attention without going anywhere:
/blog/floor-plan-symbols/keeps people 360 seconds at 1.3 pages per session. Someone looked up a symbol and closed the tab. Useful content, no commercial signal.
The pattern by section is consistent: blog pages run 1.2–1.6 pages per session, gallery pages 2.0–3.1. The gallery is the healthiest section on both loss rate and engagement, and /floor-plan-gallery/ itself reaches 5.3 pages per session at 95% engaged — the best behaviour anywhere on the site.
Engagement is a proxy, not revenue. Analytics counts a session as engaged at ten seconds, two pageviews or a key event, so it rewards depth rather than intent. It shows where visitors behave like buyers; it does not prove they become them.
Search Console names only about 38% of clicks at page level, so most of the site-wide loss sits in pages too small to be listed individually. Those pages cannot be worked from a list — but they live in these same sections, and the reported sample fell at the same rate as the site overall, so the section pattern should hold for them.
That makes the sequencing straightforward: work the named pages in the priority list first, because they are measurable and prove whether a fix works. Then apply whatever worked at template level to the blog, which is where the unnamed volume is. Fixing the tool pages one by one is worth it on its own merits — there are only twenty-nine of them and they are the worst-hit per page.
What Changed Between the Listing and the Click
This section covers the residual third only — the part ranking does not explain. One correction up front, because it rules out the obvious answer: AI Overviews did not suddenly appear in late July. They have been on the large majority of commercial and informational searches for a long time. Their arrival cannot cause a step change on a single night, and any explanation that depends on it is wrong.
The cleanest measurement that clears the volume bar
/room-planner/ is the strongest single case, because nothing about it is anomalous: its May–June baseline of 5.4 clicks a day matches its July level, so there is no inflated starting point, and its ranking improved across the break.
/room-planner/ | Jul 6 – 23 | Jul 25 – Aug 7 | Change |
|---|---|---|---|
| Average position | 12.9 | 11.0 | 1.9 places better |
| Click-through rate | 0.24% | 0.18% | −26% |
| Expected from the ranking move | — | — | +24% |
It ranked nearly two places higher and was clicked a quarter less. Ranking predicted click-through should rise by about a quarter. No positional decay curve explains a fall on a page that improved — and unlike the examples in the previous draft of this report, this one is measured from a baseline the page had been holding steadily since May.
Not That AI Overviews Arrived — That RoomSketcher Fell Out of Them
An AI Overview that has been present for months can still change what it does. The reading consistent with both the long-standing prevalence of these modules and a sharp break on July 24 is that RoomSketcher lost citation inside overviews it was previously named in, or that the module expanded and pushed the organic block further down.
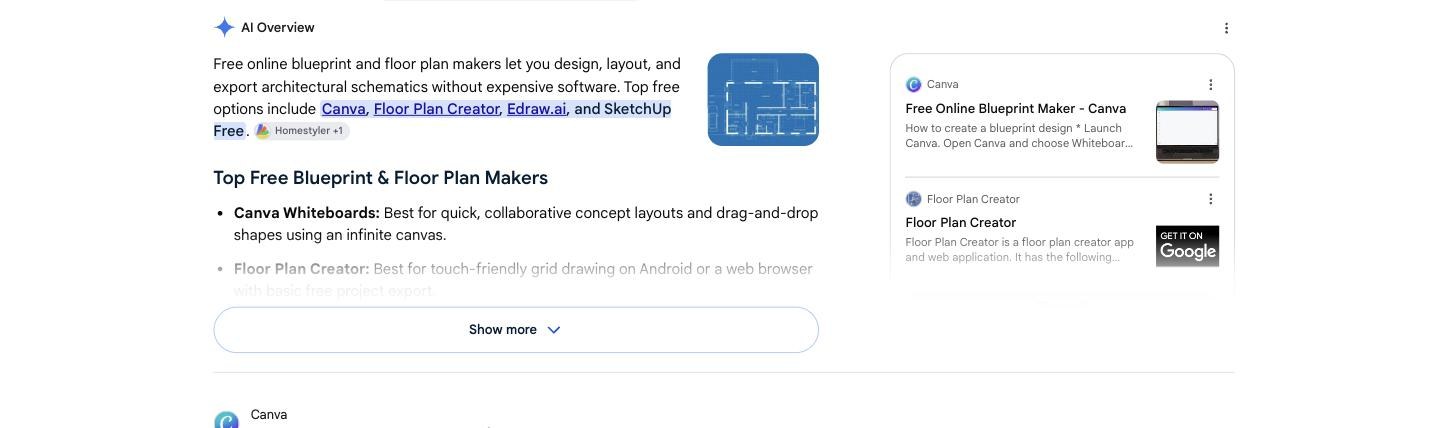
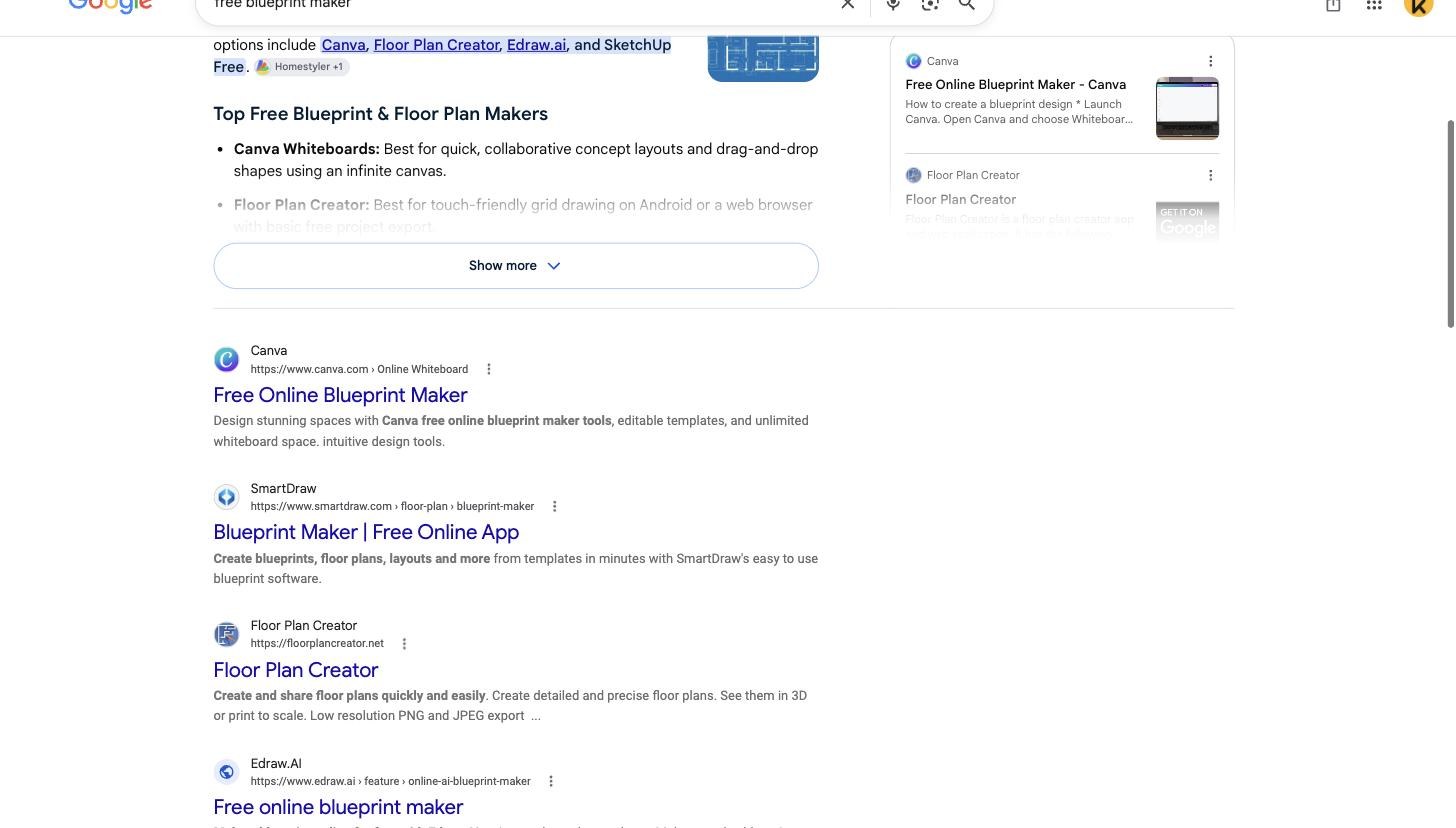
What we can confirm today: on August 9 the AI Overview for “free blueprint maker” cites Canva, Floor Plan Creator, Edraw.ai, SketchUp Free and Homestyler, and does not mention RoomSketcher — which still ranks around position four for that query. Losing a citation while holding or improving the ranking produces exactly the pattern seen on /room-planner/ above.
What we cannot confirm: whether RoomSketcher was cited there before July 24. No historical record of AI Overview citation exists for this property. This is a hypothesis that fits the evidence, not a demonstrated cause.
Why a page can hold position 5 and still lose clicks
This is the part that makes the rest make sense, and it rests on a detail about the metric itself. Search Console’s “position” is rank among organic results only. It counts nothing that Google places above them.
So a page can sit at position 5 for a year while the first organic result slides from roughly 700 pixels down the page to 1,600 — as more is stacked on top of it. The rank is identical. The listing is nowhere near where it used to be on screen. That is enough on its own to produce everything in Section 04’s SEO can’t fix group, and it does not require AI Overviews to have appeared, only for the block above organic to have grown.
Things that push the organic block down without moving your position number:
- An AI Overview getting taller — more citations, images, an expanded default state
- More ads above the fold
- People Also Ask moving up or expanding
- Video, forum or Reddit blocks being inserted
- Shopping or product panels on commercial queries
One measurement supports this reading directly: the worst-hit band across the break was positions five to ten — precisely the results that fall off the first screen when anything is inserted above them.
Eliminated:
- AI Overviews appearing for the first time — they pre-date the break by months.
- Loss of rich results — Search Console reports none for this property in any window. The FAQPage schema on every affected page has never earned anything.
- Query-mix rotation — the comparisons above are single queries measured against themselves.
- Ranking — by construction; these are the pages whose position held or improved.
Still open, and worth saying plainly:
- Google rewriting titles and snippets. It does this routinely, and a worse rewrite lowers click-through at identical rank. Not yet checked.
- Competitor listings becoming more attractive — richer snippets, sitelinks, better titles making the same position a less appealing choice. Not yet checked.
The test that would settle it is not rank data. Load the affected queries alongside a control set whose click-through held, and measure how far down the page the first organic result actually sits. If the affected queries have deeper organic blocks, that is the mechanism — and it quantifies exactly how much screen real estate has been lost and to what. A few hours of work, and it converts the leading hypothesis into a measured number before any strategy is committed to it.
What These Pages Look Like
The pages carrying the largest losses, as they appear today. All are technically sound and none look broken — which is the point. The numbers for each are in Section 04.
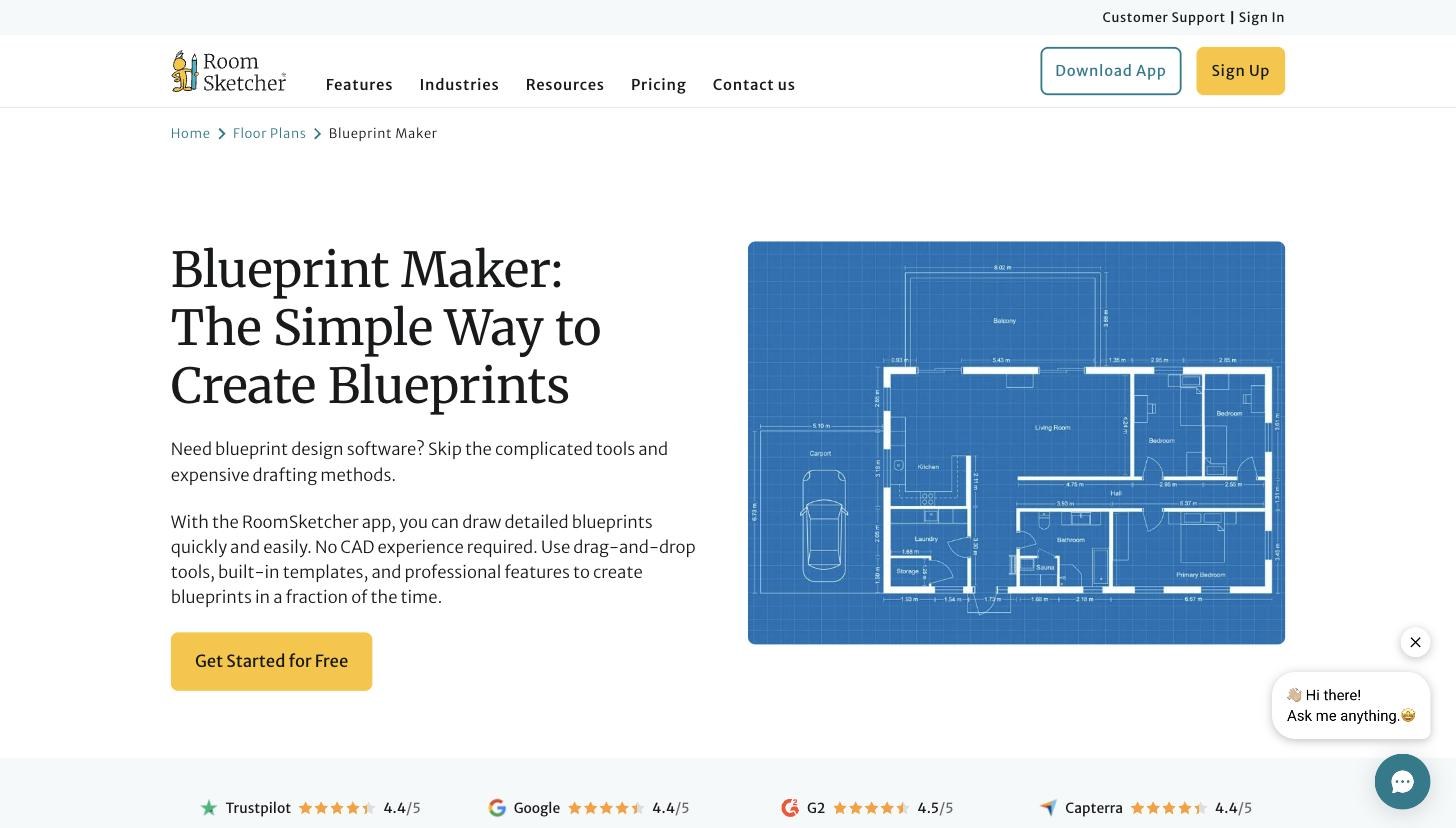
/floor-plans/blueprint-maker/ — holds its ranking and has lost clicks anyway. Opens with a brand headline rather than a direct answer to “what is a blueprint maker”.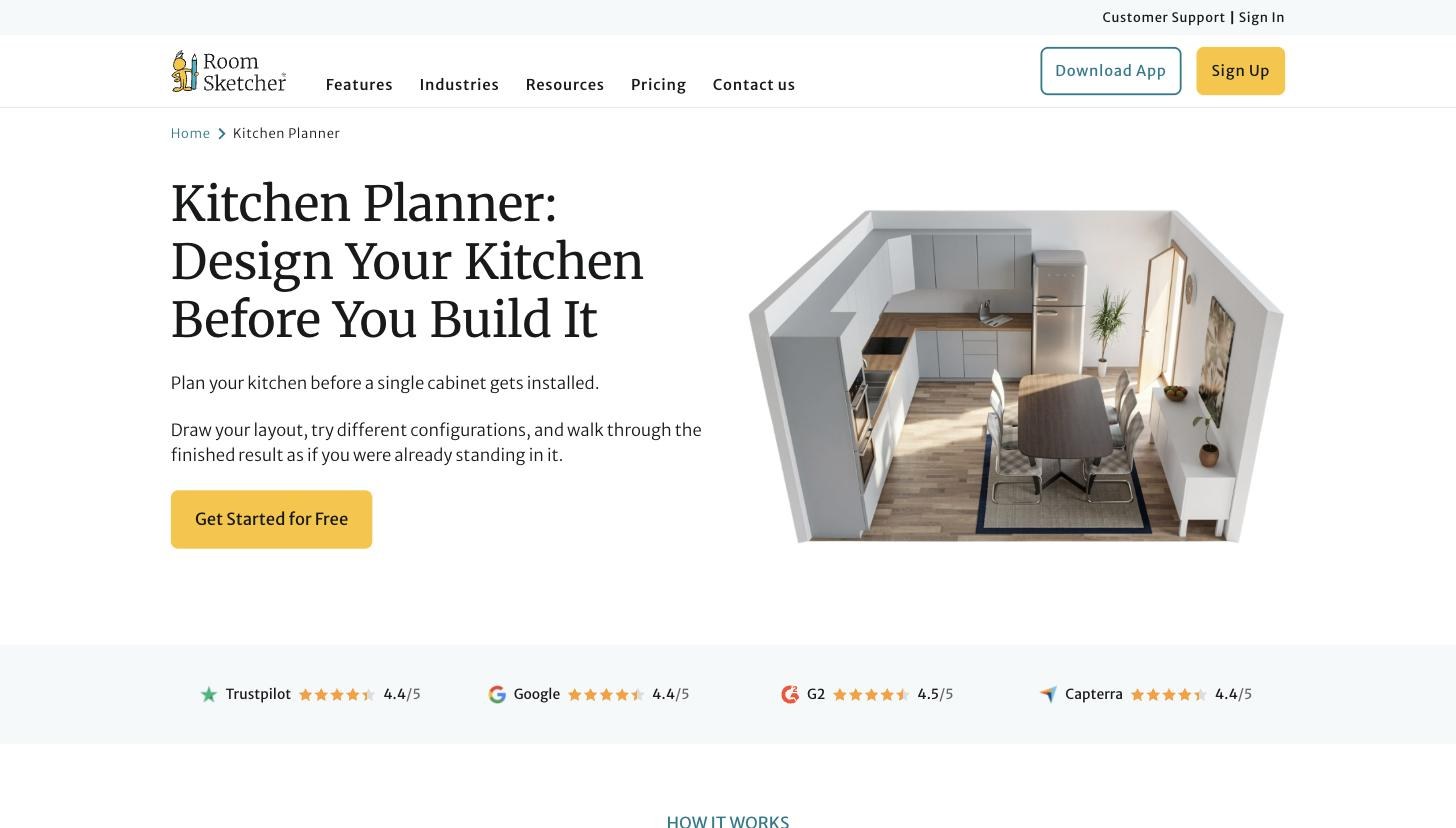
/kitchen-planner/ — demoted overnight by the June event and never recovered. Still holds rank one on brand terms only.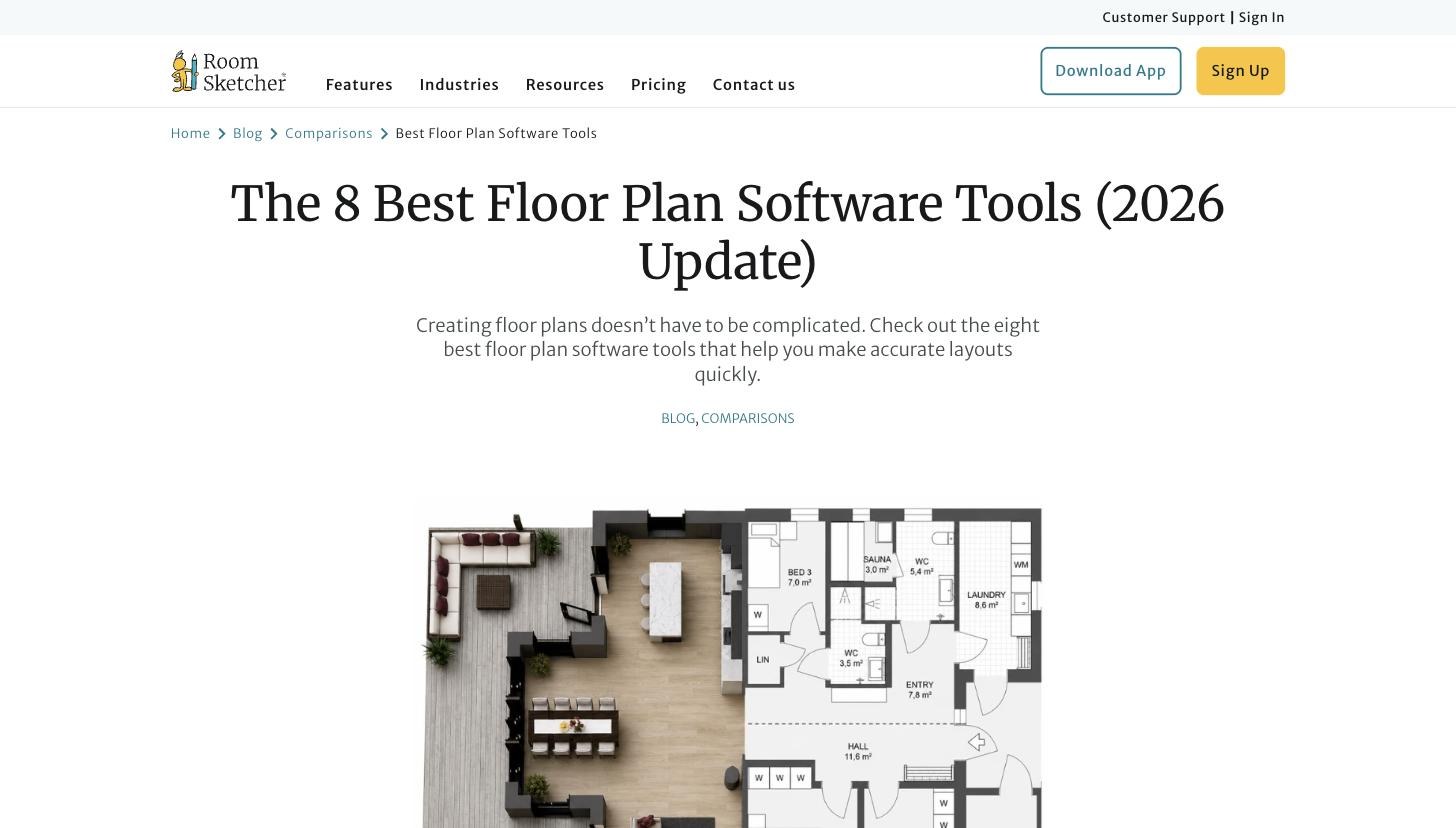
/blog/best-floor-plan-software-tools/ — the single largest click loss on the site. A roundup competing with the roundups AI Overviews cite.
/blog/best-bathroom-design-software/ — same shape as the roundup above, at a traffic level too small to draw conclusions from.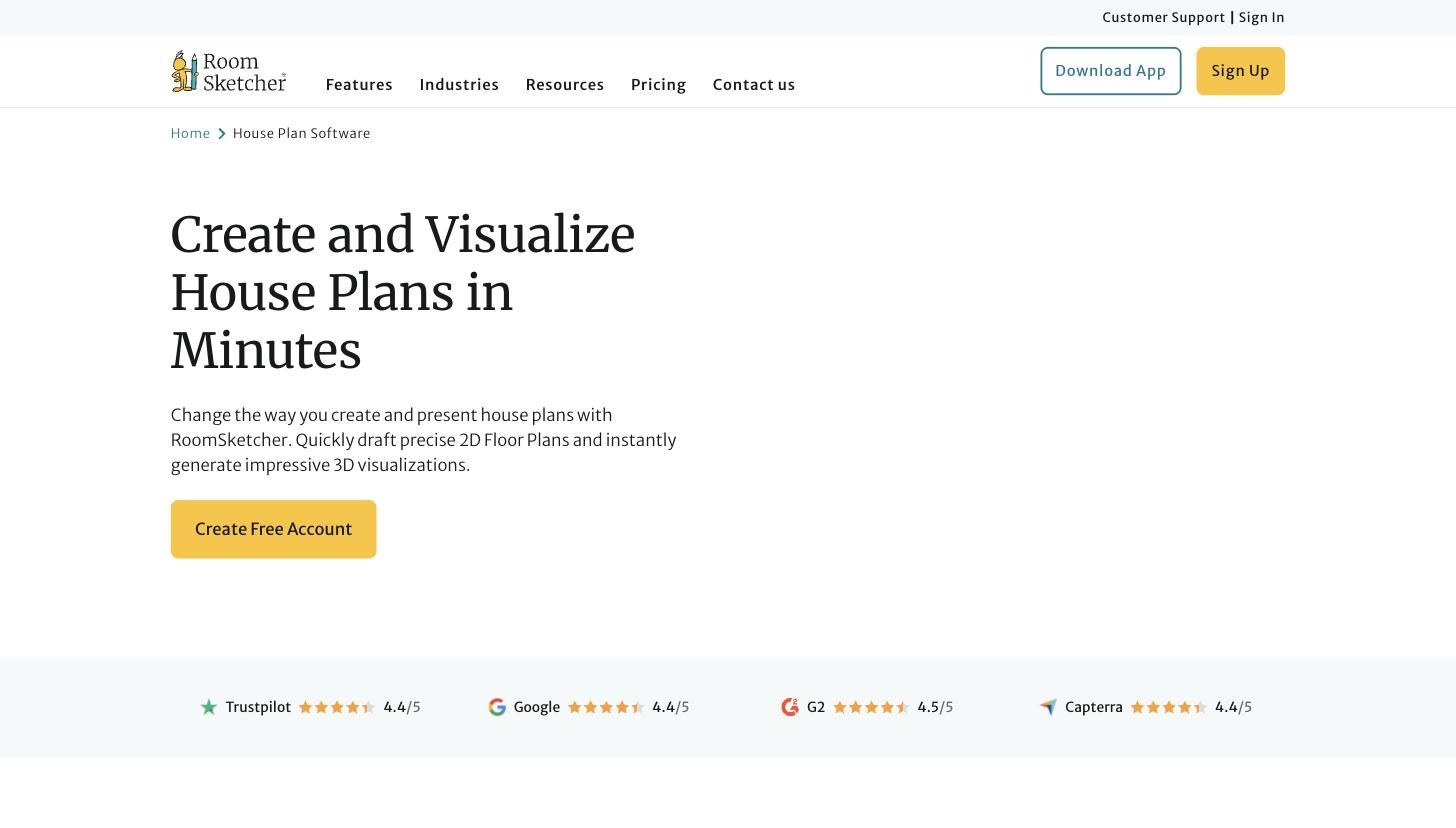
/house-plans/ — a June casualty, and one of the pages ordinary SEO should be able to recover. Note: the hero image did not render on capture — worth a separate check.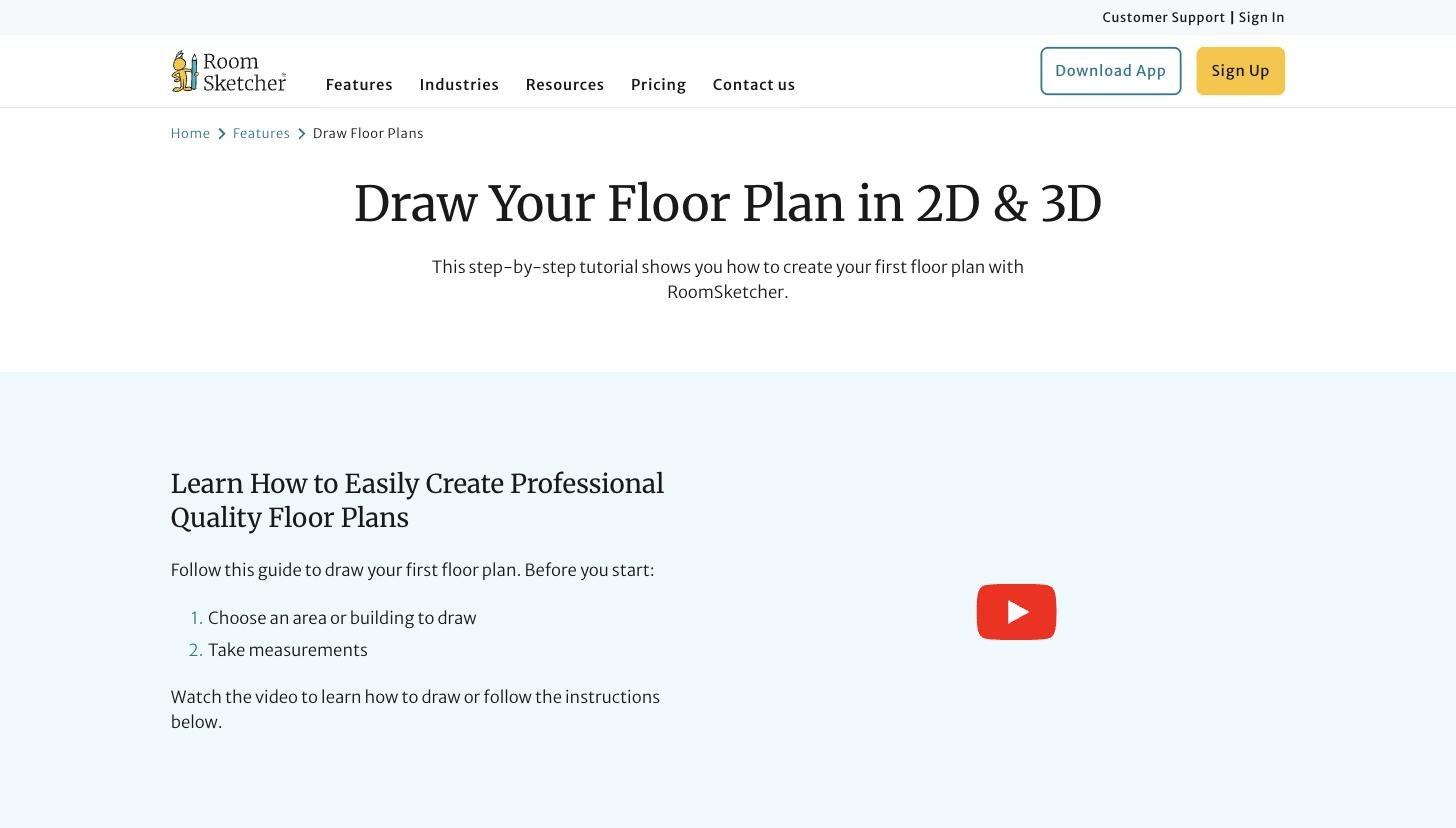
/features/draw-floor-plans/ — hit by both events. Already on the Q3 redesign list.Recommended Actions
Ordered by effort, not by importance, so work can start immediately. The loss splits into two parts that need different treatment. Roughly two thirds is ranking and impressions — ordinary SEO territory, where the June demotion also sits, and where the majority of recoverable traffic is. Roughly one third is click-through falling beyond what ranking explains, which ranking better cannot recover; there the goal is to be cited where the answers now live, and to stop measuring success with a number that no longer means what it used to. Weight the effort accordingly: most of this is winnable with conventional work.
Quick Wins — This Week
Diagnose Why Sessions Break Between www and account
Nothing else in this report can be prioritised properly until this is resolved. Every sign-up fires on account.roomsketcher.com — none on www, and the session that carried the visitor there does not survive the hop. The consequence is that no landing page can be credited with a sign-up, so we cannot tell which of the pages in Section 04 are worth recovering.
The configuration is already correct, and has been ruled out. Both GTM containers fire the same measurement ID (G‑1XJ0CC87HD), both load the same CookieYes key, cross-domain linking is set to Contains roomsketcher, and neither container overrides cookie_domain. The referral exclusion works — www.roomsketcher.com does not appear as a referral source for account traffic, which it would if this were misconfigured. Attribution is even partially crossing: account sessions include 24,993 organic, 20,528 Google paid and 8,873 Microsoft paid.
What is still wrong:
- 76% of account sessions fire
first_visit— 95,719 of 126,690. That means no_gacookie was present, on a logged-in area where returning users should always have one. - 83% are recorded as direct — 200,616 sessions with no source at all. Some of that is genuine (people bookmark the app), but not four fifths of it.
Leading candidate: consent timing. Both containers gate the Google Tag on analytics_storage, with CookieYes set to waitForTime = 2000. If consent is not resolved before the tag fires on the account app — or does not persist across the hop — Analytics runs cookieless and every hit looks like a new user. That produces this exact signature.
How to find it, in about an hour: open GA4 DebugView and walk a real journey from a Google result through to a completed sign-up, watching two things at the moment the domain changes — whether client_id stays the same, and whether analytics_storage is granted on the account page. One of three things will be true: the client ID changes (cookie scope or consent), the consent state flips to denied (CookieYes not persisting), or the tag fires before consent resolves (the waitForTime race). Each has a different and straightforward fix.
Impact: Unlocks the question that decides where effort goes — which landing pages actually produce sign-ups. It also corrects paid attribution, which is currently under-crediting Google and Microsoft by an unknown margin. Diagnosis is an hour; the fix that follows is likely a small configuration change.
Start Tracking AI Overview Citation — Not Just Presence
Presence is not the useful signal; these modules are on the large majority of searches already and have been for a long time. What matters is who gets named inside them. Track, for the top 200 commercial and informational queries: which domains the overview cites, whether RoomSketcher is among them, and how that set changes week to week. This is the one measurement that would confirm or kill the leading hypothesis, and nothing in the current stack captures it.
Impact: Converts the central unknown in this report into something observable. Without it we cannot tell whether any of the work below is having an effect.
Re-baseline Every Report and Dashboard to July 24
Any comparison window that spans July 24 now blends two different regimes and will produce misleading readings for weeks — including the fortnightly Growth Audit. Annotate July 24 in GA4 and Search Console, and set the post-event period as the new baseline for like-for-like comparison. The pre-July 24 numbers are not a target we can steer back to by effort.
Impact: Stops the next month of reporting from misattributing a Google change to campaign or content performance.
Close the Paid Gap on the Queries That Just Lost Organic Clicks
While checking the live SERPs we saw the Google Ads account flagging “S - Search - Nordic” and “S - Search - Anglo” as limited by budget, and “S - FP SW - NORAM” as paused — on exactly the commercial terms where organic clicks have just evaporated. This was an incidental observation and should be verified in the account before acting.
Impact: With $100–200/day already allocated for testing, this is the fastest available offset for 301 lost clicks a day — and the only lever that works on the same queries within days rather than months.
Confirm There Is No Manual Action
This remains the one hypothesis not yet formally closed, and the Search Console Manual Actions panel settles it immediately. We expect it to be clear — every other line of evidence points to an algorithmic and layout change — but it should be ruled out on the record rather than assumed.
Impact: Eliminates the one remaining scenario that would require a completely different response.
Medium Effort — Next Two Weeks
Rewrite the Opening of the Worst-Hit Pages to Be Citable
If the hypothesis is citation loss, the response is to make these pages easier to cite. Every affected page opens with brand-voice hero copy — “Blueprint Maker: The Simple Way to Create Blueprints” — followed by benefit statements. The pages being cited instead open with a direct, self-contained answer to the question asked. Add a short, factual, quotable answer block in the first 100 words: what the tool is, what it does, what it costs, who it is for. Keep the hero; put the answer immediately beneath it. Start with the five pages carrying an unexplained residual in Section 04, not all of them.
Impact: The highest-leverage on-site change available for the residual third. Pair it with #1 so the effect is measurable rather than assumed.
Get RoomSketcher Into the Roundups the AI Overviews Actually Cite
These AI Overviews synthesise heavily from third-party comparison articles and video. RoomSketcher publishes its own excellent roundup, but Google is citing other people's. Identify the specific sources named in the AI Overviews for the top 50 commercial queries and pursue inclusion in them — outreach, updated product data, review-site profiles, and YouTube coverage, which appears repeatedly in the citation panels we captured.
Impact: Attacks the citation surface directly. Slower than on-page work but far more durable.
Re-scope the Q3 Page Redesign Around Citability
Q3 Objective 2, Initiative 2 — ten high-traffic feature and landing pages redesigned, owner Trude, due September — already targets this exact page shape, and /features/draw-floor-plans/, /features/roomsketcher-app/ and /kitchen-planner/ all qualify. That target list was drawn up before any of this analysis existed. Confirm the ten pages overlap the affected set and add AI Overview citability to the brief alongside UX.
Impact: Redirects work already funded and staffed for Q3 toward the highest-value problem on the site, at no additional cost.
Work the Pages That Lost Rank — This Is the Bigger Half
Two thirds of the loss is ordinary ranking decline, and it should be the main effort. 108 pages slipped a median of two places across July 24; nine of the twenty biggest losers — including the homepage, /house-plans/ and /features/roomsketcher-app/ — show click-through changes fully explained by that slip and nothing more. Treat these as a normal ranking recovery: check what now outranks them, whether the competing pages are fresher or more thorough, whether internal linking weakened, and whether query intent has drifted.
Impact: The largest single recoverable block — on the order of 200 clicks/day if rankings are restored, and it responds to work we already know how to do.
Audit the FAQ Schema — It Is Earning Nothing
Every affected page carries FAQPage and Answer markup, and Search Console reports no rich-result appearances for this property at all in either window — only translated results. The schema is not producing rich snippets and has not been. That is not the cause of the July drop, but it means a visible block of every page is doing no search work while adding length and templating to pages already suspected of looking scaled. Confirm in the Rich Results report, then decide whether to keep it.
Impact: Removes a false assumption from the SEO plan and feeds directly into the de-templatisation test in #11.
Strategic — Next 30 Days and Beyond
Rebalance Content Investment Away From the Informational Cluster
The /blog/how-to-* and definitional pages are structurally exposed: Google now answers “how to read floor plans” and “what rooms are in a house” completely, within the results page. That traffic is not coming back, and more articles of the same shape will not perform. Shift investment toward things an AI summary cannot substitute for — interactive tools, original data, template libraries, gallery depth, and bottom-funnel comparison pages where users still need to reach a product.
Impact: Stops spending against a permanently shrinking surface and moves budget to defensible ground.
Change How Organic Success Is Measured
If AI Overviews increasingly show RoomSketcher without generating a click, organic sessions will understate performance permanently. The metrics that still carry signal are branded search volume, impression share on target queries, AI Overview citation rate, engagement rate by landing page, and — once #1 is done — sign-ups per landing page. We recommend agreeing a revised organic scorecard before the next Growth Audit, rather than continuing to report a number that now measures Google's layout as much as RoomSketcher's performance.
Impact: Keeps the board-level story honest and prevents a structural industry shift from reading as an execution failure.
Let the June Test Run Undisturbed
The controlled experiment proposed on August 3 still stands: de-templatise /kitchen-planner/ alone — cut the FAQ block, add genuine unique substance, keep the URL — and leave the other eight June-affected pages untouched as a control. Four to six weeks of monitoring. Do not mass-edit all nine, and do not confound it with the July work above; if either event resolves on its own at the next update cycle, simultaneous edits would destroy any ability to attribute the recovery.
Impact: Preserves the only clean read we will get on whether page-level remediation does anything at all.
How This Was Established
Included so the analysis can be reproduced or challenged.
- Source: Google Search Console API, property
https://www.roomsketcher.com/, data through August 7, 2026. - Comparison windows: July 6–23 (18 days, pre-event) against July 25–Aug 7 (14 days, post-event). July 24 is excluded from both as the transition day. All figures are daily averages so unequal windows stay comparable.
- Break detection: seven-day trailing mean of daily clicks, flagged where the mean fell more than 3% below the prior day's mean.
- Seasonality control: identical calendar windows in 2025, same property, same country filter.
- Ranking movement: all pages with ≥30 impressions/day in the pre-window (n = 263), change in average position measured across the break, unfiltered.
- CTR curve: pages grouped into position bands using each window's own average position, so no page is selected on how its position changed. CTR computed per band as total clicks over total impressions.
- Loss decomposition: counterfactual holding the pre-event CTR-by-position curve fixed while applying post-event impressions and positions; the residual is attributed to CTR at constant position. Cross-checked against a log-ratio split of the site-wide impression and CTR components (42/58), which uses complete totals rather than the page-level subset.
- Position-stable cohort: pages with ≥30 impressions/day and |Δposition| ≤0.6 (n = 100). Reported as corroboration only — it conditions on the outcome under test and cannot carry the causal claim by itself.
- SERP observation: live Google results captured August 9, 2026 from a US desktop session with
gl=us&hl=en. Results were personalised to a signed-in browser, so citation sets may vary slightly for other users. - Fix classification: a page is marked SEO can fix where its current average position is at least 20% worse than its May–June normal; otherwise SEO can’t fix, meaning it holds its former position and has lost clicks anyway. Taken straight from measured position, with no modelling.
- Baseline check: every page in the main table is shown against its own May–June average. Where the July window sat above that average, the pre-break figure is a spike and the measured fall is overstated; those rows are marked and restated. The homepage was excluded on this basis — its July level was 44% above its own norm.
- Known limits: query-level splits use the top 5,000 queries Search Console returns and understate long-tail effects. No historical record of AI Overview presence exists for these queries, so the timing of their appearance is inferred, not measured.